Information for Developers
Plug-ins
You may need to install extra dependencies for some plug-ins, such as the autofocus plugin.
pip install -r tests/requirements.txt
To write plug-ins, see the Writing Plug-ins section. To run plugins, see the Command-line interface section.
Testing
Running tests
pytest tests
If you don’t wish to run the benchmarking tests (which can take some time) use
pytest tests --ignore=tests/benchmarking_tests
Benchmark Testing
For more information on benchmarking, see pytest-benchmark.readthedocs.io. One can run the benchmarking tests locally with
pip install -r tests/benchmarking_tests/requirements.txt
pytest tests/benchmarking_tests
To create a local benchmark file (with which you can compare further tests), use
pytest tests/benchmarking_tests --benchmark-save="NAME"
where “NAME” should be similar to “user_date_otherinfo” for tracking purposes, e.g., “eoghan_190321_WINpy38.json”. Note that a counter is appended as a prefix in the saved file, e.g., “0001_eoghan_190321_WINpy38.json”
Then, when you need to make sure new changes aren’t regressing Shape-Link, use
pytest tests/benchmarking_tests --benchmark-compare="*/0001_eoghan_21-03-19_WINpy38" --benchmark-compare-fail=median:5%
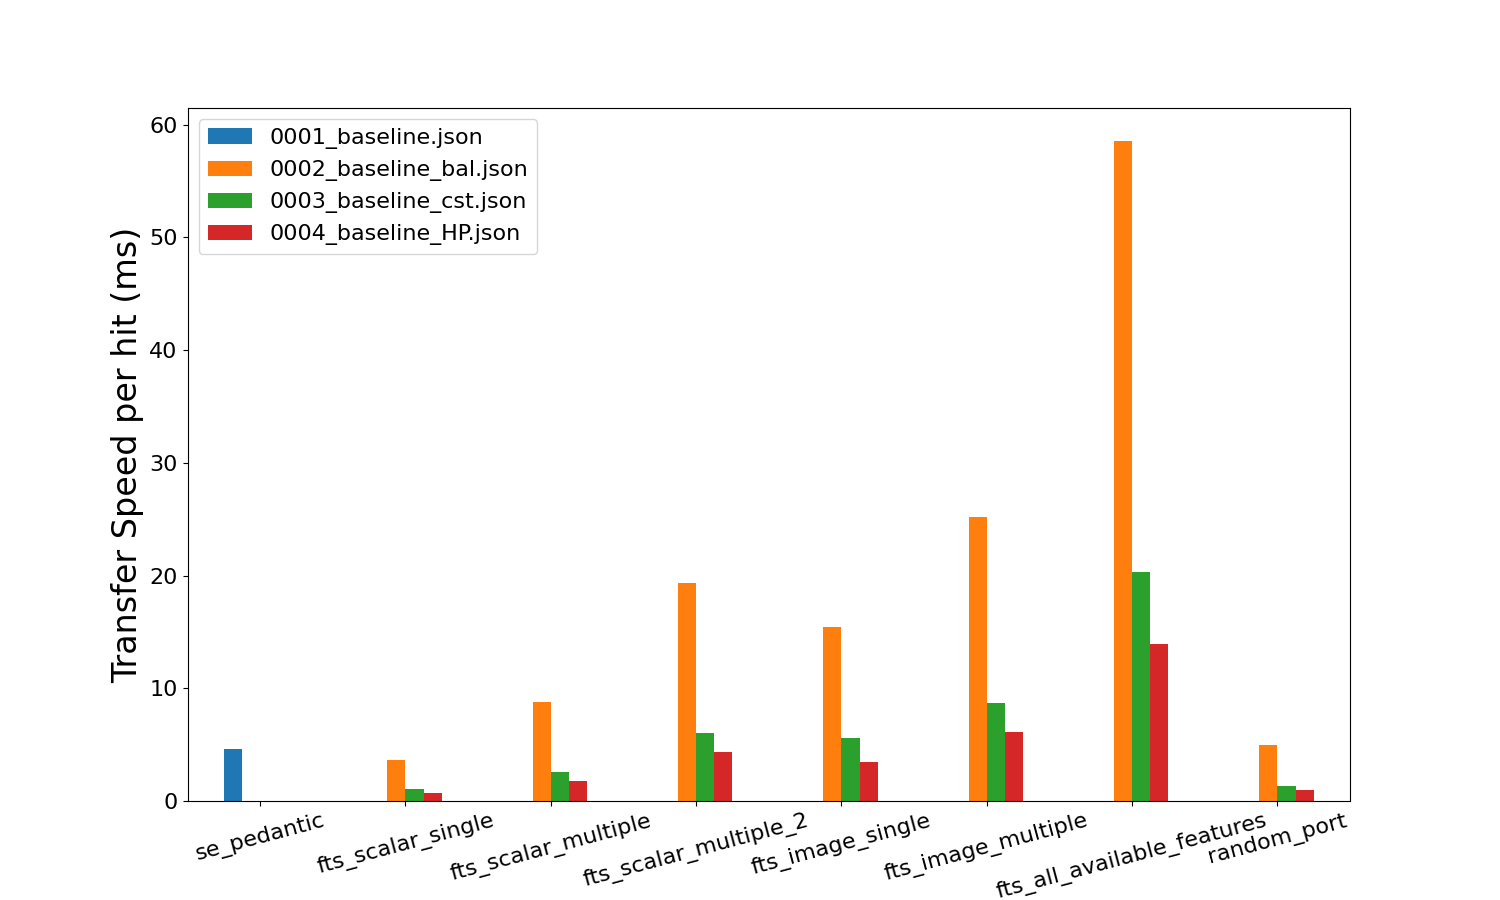
Feature transfer speeds
You can output plots that compare benchmark tests. They show how long each feature transfer takes in milliseconds. This is helpful for understanding how fast each feature can be transferred during acquisition.
Note
These transfer values include the initial time taken for the server and client to connect. Therefore, the plots overestimate the transfer values. To get a more accurate transfer value, use line_profiler (kernprof).
python tests\benchmarking_tests\benchmark_utils.py
These plots will be saved locally in the same directory.
Adding a new Benchmark for Github Actions
Shape-Link uses continuous integration with GitHub Actions. The benchmarking tests are run under the “Benchmark with pytest-benchmark” step. Any push or pull requests will trigger this step. To add a new benchmark file for GitHub Actions, follow the steps below:
Note
GitHub Actions currently builds a matrix of OS and Python versions. Therefore, minor warnings will appear stating that the OS or Python versions don’t match the current benchmark comparison files. You can ignore this warning. We recommend using the output from the Ubuntu-py3.7 build to create the new benchmark file, as it is the slowest.
Push your changes. Then go to the GitHub Actions build tab on GitHub. If the benchmarking tests passed, open the “Benchmark with pytest-benchmark” output.
Under the “===== passed =====” log, copy the contents of the output.json file. Do not copy the ZMQ errors. Paste in a new .json file in your local repo in the ./.benchmarks_github_actions folder. This file should be named similar to: ActionsBenchmark_21-03-19_UBUNTUpy38.json, where the date should change (yy-mm-dd).
Open the ./.github/workflows/checks.yml file and replace the name of the –benchmark-compare=”actions_benchmarks/ActionsBenchmark_190321_ubuntu_py38” to the name of your file.
Commit and push your changes. Now the github actions workflow will compare its live benchmark run to the new file you just created.
Using line_profiler (kernprof)
The above benchmarking tests are good but not perfect estimations of feature transfer speed. They have a flaw: the initial time taken to connect the server and client is included in the transfer speed value. This initial time is sometimes a substantial (~33%) part of the overall time.
line_profiler, formally kernprof, is a package that tests the speed
of excecution of each line of code in your program. You just need to
install line_profiler and decorate the relevant functions with the
@profile decorator.
Installing line_profiler
See installation details on the official pyutils repository. First try to install with pip:
pip install line_profiler
If you are using windows and pip install line_profiler does not work,
use one of these
pre-built wheels.
Once you have downloaded the correct wheel for your computer architecture,
you can install the wheel with pip:
pip install path\to\the\wheel
Using line_profiler
The official pyutils repository has a
short guide.
Place @profile above the function you wish to profile.
Then, run the following in terminal:
kernprof -l -v path/to/file.py